
CLI Beginner’s Guide
Note
This guide assumes you already have plotypus installed, and that you are using a BASH shell on a UNIX-like operating system.
The plotypus package comes with a command line tool of the same name, which should be installed to your path. To see a list of available options, run:
>> plotypus --help
For the sake of this tutorial, create an empty folder named plotypus-tutorial, and enter that directory:
>> mkdir plotypus-tutorial
>> cd plotypus-tutorial
Now, before you can use the tool, you will need some variable star photometry. We have provided a small sample of photometry from the OGLE-III catalog, here [USSP]. Download and extract the data:
>> curl -O https://astroswego.github.io/plotypus/_static/samples/ogle-sample0.tar.gz
>> tar -xvzf ogle-sample0.tar.gz
Now your directory should look like this:
plotypus-tutorial/
├── ogle-sample0
│   ├── OGLE-LMC-CEP-0002.dat
│   └── OGLE-LMC-CEP-0005.dat
└── ogle-sample0.tar.gz
We are going to use plotypus to find the period of OGLE-LMC-CEP-0002, and then fit a light curve to it. Finding periods is time consuming, and since we already know the periods of these stars, we are going to constrain the range of periods searched between 3.0 and 6.0 days. Try calling plotypus like so:
>> plotypus -i ogle-sample0/OGLE-LMC-CEP-0002.dat --min-period 3.0 --max-period 6.0
A table should be printed to your terminal, containing various light curve
parameters. You can omit the --min-period and --max-period switches,
but it will take much longer to run.
Now try running it on the entire directory:
>> plotypus -i ogle-sample0/ --min-period 3.0 --max-period 6.0
This time you should see a table like before, but with two entries. Let’s run this same command again, but this time, redirect the results to a file.
>> plotypus -i ogle-sample0/ --min-period 3.0 --max-period 6.0 > output.dat
Notice that the first and second columns contain the name and period of the stars? Why don’t we extract those columns, and save them to a file, so that we don’t have to wait for the period to be found every time.
>> cut -f 1,2 --output-delimiter=" " output.dat | tail -n +2 > periods.dat
Now we can run plotypus as before, but instead of providing a period range, we will provide the periods file:
>> plotypus -i ogle-sample0 --periods periods.dat
Much faster than before, right? We’ll use the periods file for the rest of the tutorial.
Now you’ve seen how to process a single file, or an entire directory of files, but what if you had a list of specific files? Fret not, because plotypus can read this as input too. The file must contain, on each line, the relative or absolute path to a desired file. Let’s make a file which lists all the files in the ogle-sample0 directory. For relative paths you can run:
>> ls -d -1 ogle-sample0/* > names.dat
or for absolute paths:
>> ls -d -1 $PWD/ogle-sample0/* > names.dat
Take a peek inside names.txt:
>> cat names.txt
To tell plotypus to process the files named in this list, you can do one of two things.
Provide the file with the
-iswitch as before, but prefix the file with an@symbol:>> plotypus -i @names.dat --periods periods.dat
Pipe the file to plotypus via standard input, and omit the
-ioption:>> cat names.dat | plotypus --periods periods.dat
You should see the same exact output as when you gave plotypus the directory as input.
Now let’s generate some plots (it isn’t called plotypus for nothing).
Run plotypus in any of the ways you did before, but this time add the -o
switch, and provide an output directory. We will do it like this:
>> plotypus -i @names.dat -o plots/ --periods periods.dat
You will see the same table output as before, but now a new directory and some plots have been created. Your directory should look like this:
plotypus-tutorial/
├── names.dat
├── ogle-sample0
│   ├── OGLE-LMC-CEP-0002.dat
│   └── OGLE-LMC-CEP-0005.dat
├── ogle-sample0.tar.gz
├── output.dat
├── periods.dat
└── plots
    ├── OGLE-LMC-CEP-0002.png
    └── OGLE-LMC-CEP-0005.png
Using your image viewing software of choice, take a look at the two plots you just created. They should look something like this:
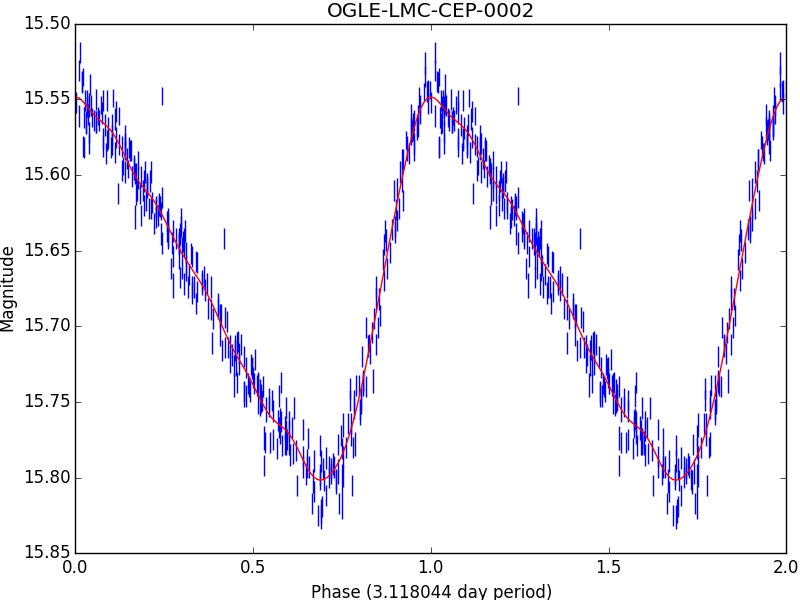
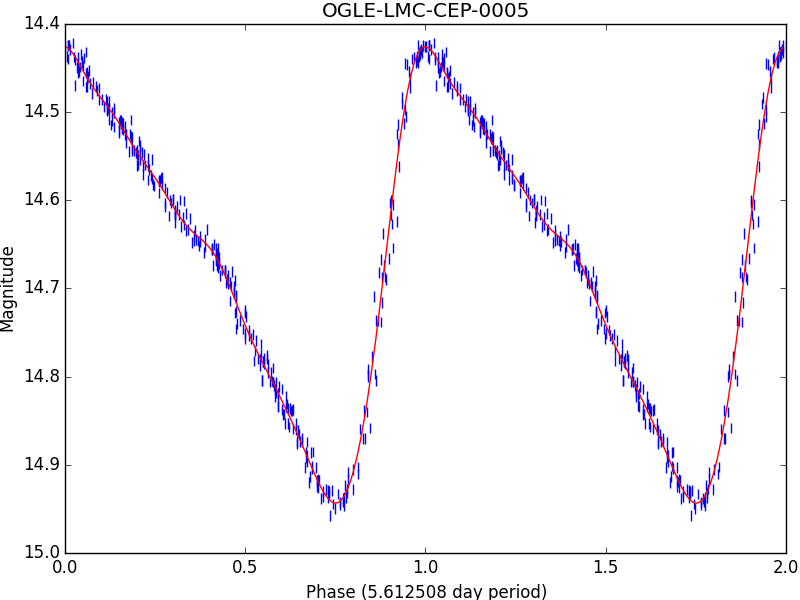
That covers all of the basic functionality of plotypus. Continue on to the Intermediate Guide.
Citations
| [USSP] | Udalski, A. ; Szymanski, M. K. ; Soszynski, I. ; Poleski, R., 2008, “The Optical Gravitational Lensing Experiment. Final Reductions of the OGLE-III Data”, Acta Astronomica, vol. 58, pp. 69-87 |